
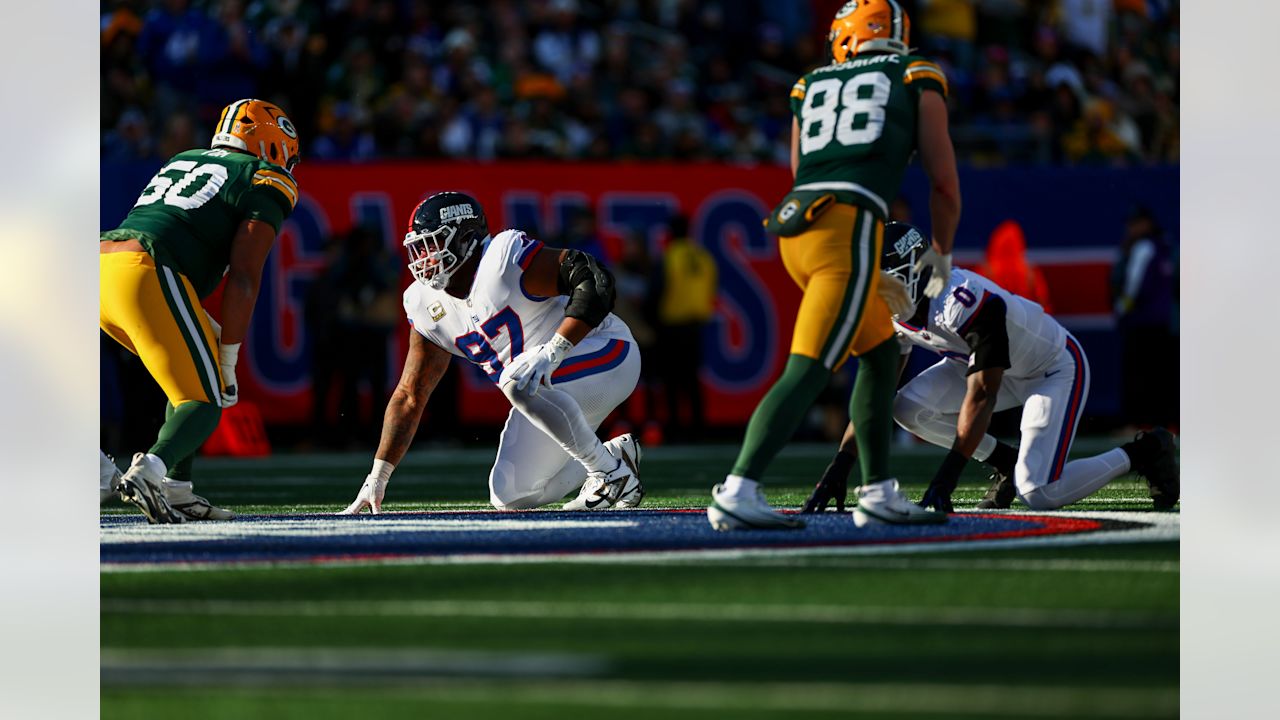
The matchup between the Green Bay Packers and the New York Giants offered far more than a simple final score. While Green Bay emerged with a 27–20 victory, the deeper story lies within the player statistics, efficiency metrics, and situational execution that shaped the outcome. Looking beyond surface-level numbers provides valuable insight into how each team performed and where the game was ultimately decided.
This detailed recap compares Packers vs Giants player stats across passing, rushing, receiving, defense, and situational football, revealing which performances mattered most and why efficiency outweighed raw production.
Game Overview and Statistical Context
The Week 11 contest brought together two teams with contrasting approaches. The Giants focused on sustained drives and ball movement, while the Packers leaned on balance, efficiency, and timely execution. Although New York finished with comparable total yardage, Green Bay’s ability to maximize scoring opportunities and limit mistakes proved decisive.
From a statistical perspective, this game reinforces a recurring NFL trend: teams that excel in red-zone efficiency, turnover control, and third-down execution usually prevail, regardless of total yardage.
Quarterback Performance Comparison
Packers Quarterback Metrics
Jordan Love delivered a composed and controlled performance. His stat line did not rely on volume, but his efficiency was evident in key situations.
Key numbers:
- Passing yards: 174
- Touchdowns: 2
- Interceptions: 0
- Third-down completion rate: strong in high-leverage moments
Love’s ability to protect the football and convert scoring chances made a measurable difference. Rather than forcing throws, he relied on timing and decision-making, which kept Green Bay ahead late in the game.
Giants Quarterback Metrics
Jameis Winston led the Giants with a more aggressive passing approach.
Key numbers:
- Passing yards: 201
- Total touchdowns: 2 (1 passing, 1 rushing)
- Interceptions: 1
While Winston generated solid yardage, efficiency declined under pressure. The interception in the fourth quarter became one of the game’s pivotal moments, underscoring how a single statistical error can outweigh earlier production.
Passing Game Efficiency
Green Bay Passing Trends
The Packers prioritized efficiency over volume. Rather than stretching the field constantly, they focused on manageable throws and red-zone precision.
Key trends:
- Higher touchdown-to-attempt ratio
- Strong red-zone completion percentage
- Limited negative plays
This approach minimized risk and allowed Green Bay to maintain control, particularly in the second half.
New York Passing Trends
The Giants moved the ball well between the 20s but struggled to finish drives.
Key trends:
- Respectable yards per completion
- Lower red-zone conversion efficiency
- Increased pressure impact late in the game
The contrast between movement and scoring efficiency explains much of the final result.
Rushing Game Breakdown
Packers Rushing Stats
Green Bay’s rushing attack played a crucial supporting role.
Aaron Jones led the way with:
- 89 rushing yards
- Nearly 5 yards per carry
- Consistent first-down gains
Complementary backs contributed in short-yardage situations, helping sustain drives and control the clock. The Packers’ rushing efficiency allowed their offense to remain balanced throughout the game.
Giants Rushing Stats
New York’s rushing production was most effective near the goal line.
Key rushing outcomes:
- Multiple rushing touchdowns
- Solid short-yardage efficiency
- Limited explosive runs
While the Giants did not dominate on the ground, their ability to convert rushing attempts into points kept them competitive.
Receiving Production and Efficiency
Packers Receivers
Christian Watson delivered the most impactful receiving performance of the game.
Watson’s numbers:
- 5 receptions
- 64 yards
- 2 touchdowns
- Significant yards after the catch
Although his target volume was modest, his scoring efficiency made him one of the game’s most influential players. Other receivers contributed through route discipline and blocking, elements that do not always appear in box scores but affect overall offensive success.
Giants Receivers
The Giants spread production across multiple receivers.
Notable contributions:
- Isaiah Hodgins provided consistent chain-moving catches
- Wan’Dale Robinson contributed in short-yardage situations
Despite balanced receiving numbers, the lack of explosive scoring plays limited New York’s offensive ceiling.
Tight End Usage
Tight ends on both teams played important but understated roles.
Packers tight ends:
- Reliable short-yardage targets
- Effective blocking in the run game
Giants tight ends:
- Utilized in play-action sets
- Contributed to drive sustainability
While tight ends were not statistical leaders, their efficiency supported overall offensive execution.
Defensive Player Statistics
Packers Defensive Performance
Green Bay’s defense delivered in high-impact moments.
Key defensive stats:
- One crucial interception
- Multiple quarterback pressures
- Several third-down stops
The late interception shifted momentum and effectively sealed the game. From a numbers standpoint, Green Bay’s defense excelled where it mattered most.
Giants Defensive Performance
The Giants defense showed flashes but lacked consistency.
Key stats:
- Tackles for loss
- Quarterback pressures
- Red-zone coverage struggles
Despite generating pressure, defensive breakdowns allowed Green Bay to convert scoring opportunities efficiently.
Situational Football: Third Downs and Red Zone
One of the clearest statistical differences came in situational performance.
Packers:
- Higher third-down conversion rate
- Strong red-zone touchdown efficiency
Giants:
- Moderate third-down success
- Fewer red-zone touchdowns
These numbers explain how Green Bay won despite similar overall production.
Turnover Impact and Discipline
Turnover margin played a decisive role.
Packers:
- Zero giveaways
- One takeaway
Giants:
- One interception
- No takeaways
From a statistical perspective, this difference directly influenced field position, momentum, and scoring opportunities.
Special Teams Comparison
Special teams quietly supported Green Bay’s efficiency.
Packers:
- Strong kickoff coverage
- Reliable kicking performance
Giants:
- Average return yardage
- No major mistakes, but limited impact
Field position advantages helped the Packers maintain control throughout the game.
Player Impact Through the Numbers
Statistics become most meaningful when viewed together. Green Bay’s players maximized efficiency, while New York’s players produced more volume without matching impact. A closer look at how individual performances shaped the Packers vs Giants outcome shows how key contributors on both sides influenced momentum, scoring, and late-game execution.
Key Statistical Trends from the Matchup
Several trends stand out when comparing Packers vs Giants numbers:
- Efficiency outweighed volume
- Red-zone execution decided scoring outcomes
- Turnovers had outsized impact
- Defensive plays in critical moments shifted momentum
These trends reinforce why advanced metrics matter when evaluating performance.
Efficiency vs Production
This game highlights the difference between raw production and true impact.
Examples include:
- Jordan Love’s modest yardage paired with high scoring efficiency
- Christian Watson’s limited targets producing two touchdowns
- Giants’ higher yardage total without matching point output
Efficiency often provides a better indicator of influence than volume alone.
What the Numbers Mean Moving Forward
Packers Outlook
Statistically, Green Bay demonstrated:
- Offensive balance
- Defensive playmaking ability
- Strong situational awareness
If these trends continue, the Packers remain well-positioned for sustained success.
Giants Outlook
The Giants showed promise but must improve:
- Red-zone execution
- Turnover management
- Late-game efficiency
Small statistical improvements could significantly change future outcomes.
Conclusion
When comparing Green Bay and New York player stats, the Packers’ victory was built on efficiency, discipline, and execution in critical moments. While the Giants produced comparable yardage, Green Bay’s ability to convert opportunities into points ultimately decided the game.
This Packers vs Giants game recap shows why advanced numbers, situational metrics, and player efficiency provide a clearer understanding of NFL results than box scores alone.